
My Portfolio
This portfolio highlights a selection of my work across criminal intelligence analysis and custom data solutions. From identifying patterns in criminal activity to building automated tools that streamline processes, each project reflects my focus on using data to drive smarter decisions.
Crime Analysis

This interactive Excel dashboard automates crime data tracking and visualization, allowing for real-time trend monitoring and faster identification of emerging hotspots. Designed to reduce manual data entry and streamline weekly reporting, it empowers leadership to make informed operational decisions with up-to-date intelligence.
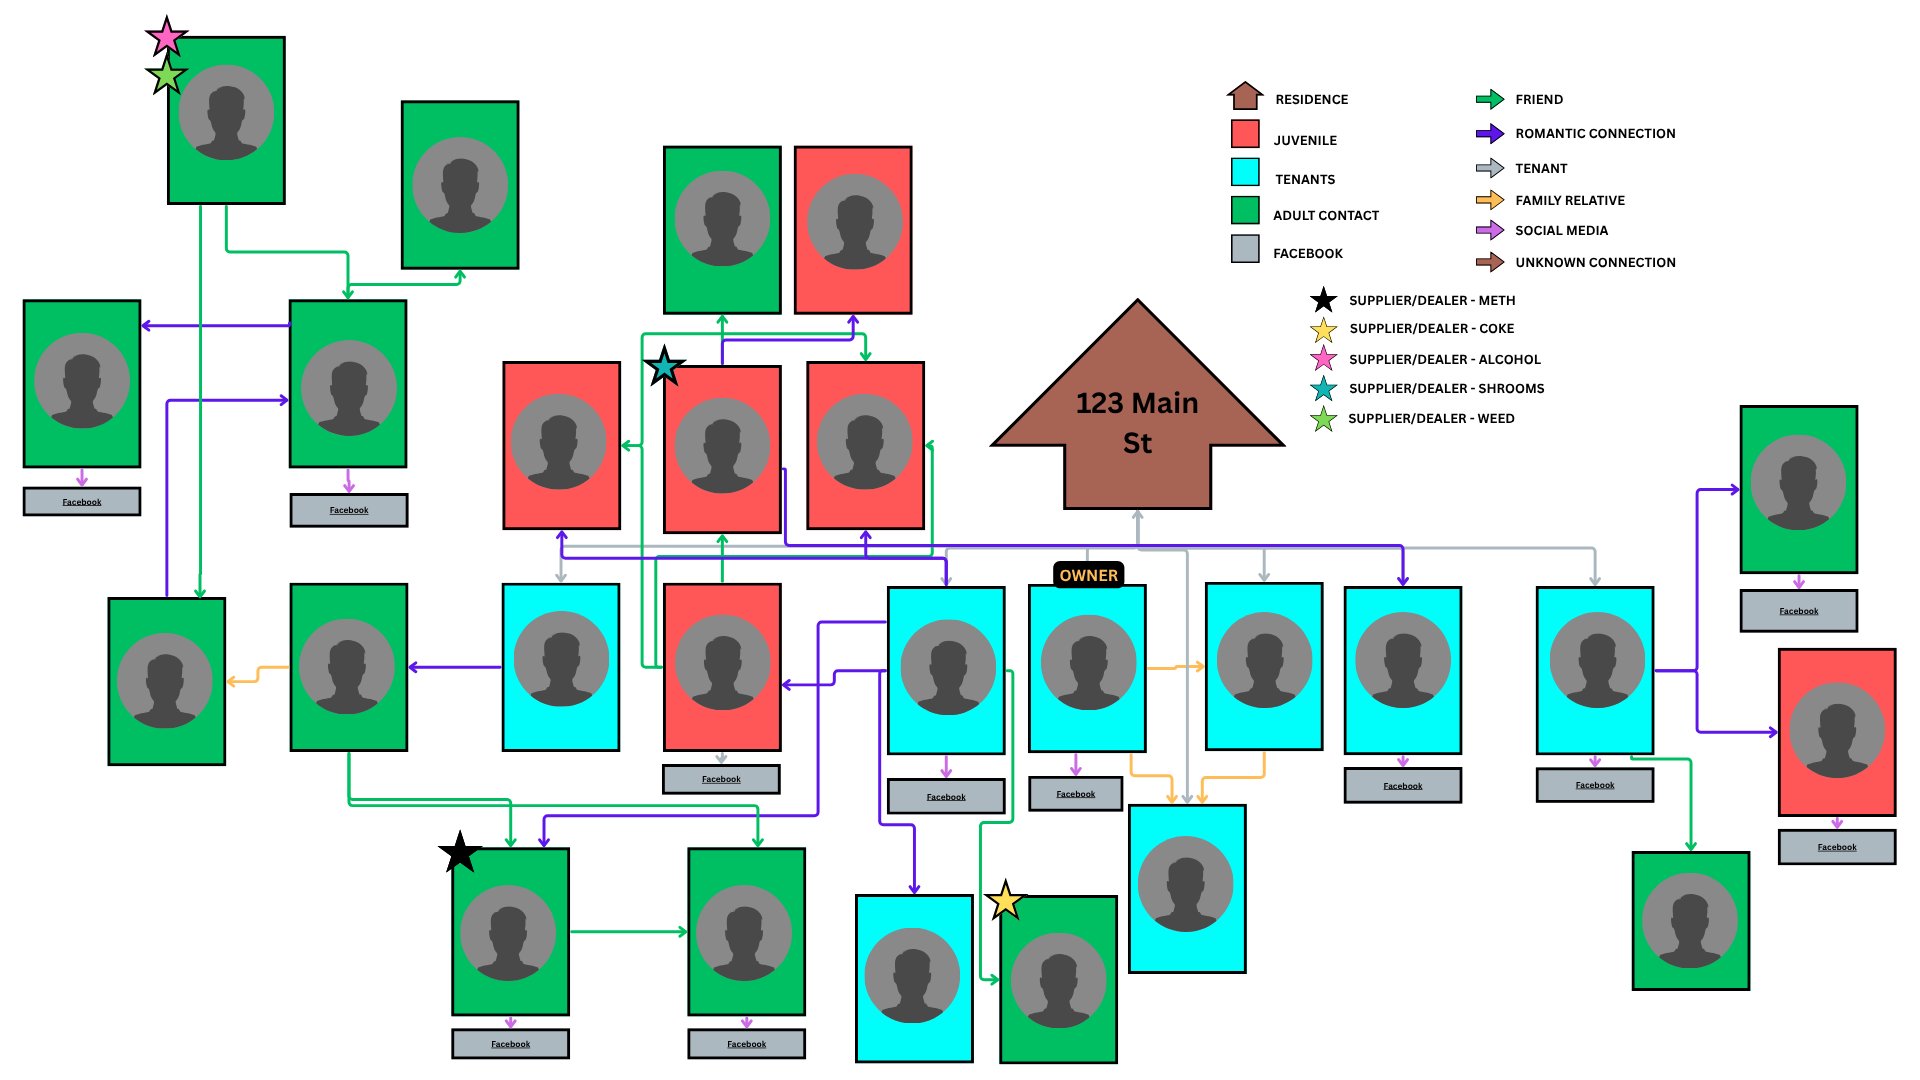
This Link Chart was created for an investigation that covered multiple cases involving a house with suspects engaging in inappropriate relations with juveniles as well as drug use. The chart has keys to identify the types of connections to each node.
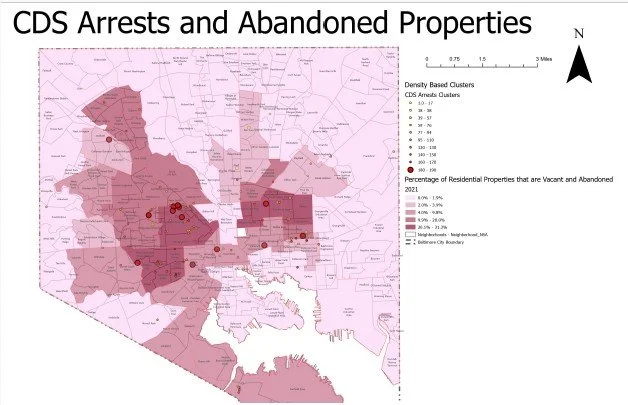
CDS Arrests and Abandoned Properties displayed in Density-Based Clusters (Baltimore, 2021)

Media Interview with KWCH 12 News on the Quarterly Crime Statistics in McPherson, Kansas
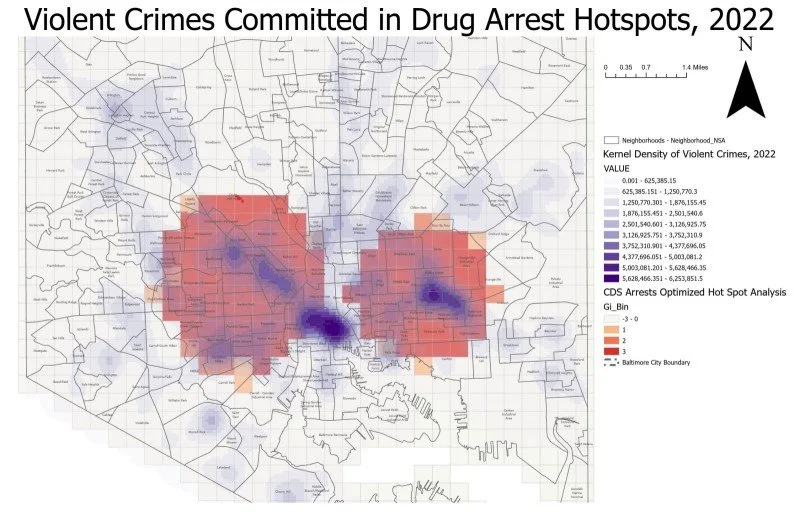
A Kernel Density analysis shows that a higher percentage of violent crimes do occur within or near the CDS Arrest hotspots in Baltimore in 2022.
Customized Data Solutions
Custom Publishing Database – Google Sheets Automation
This project was developed for a book publishing company to manage a catalog of over 200 titles. I built a fully customized Google Sheets solution featuring automated workflows, dynamic data visualization, and clean, user-friendly formatting. The tool streamlines title tracking, metadata management, and performance insights — all without the need for third-party software.
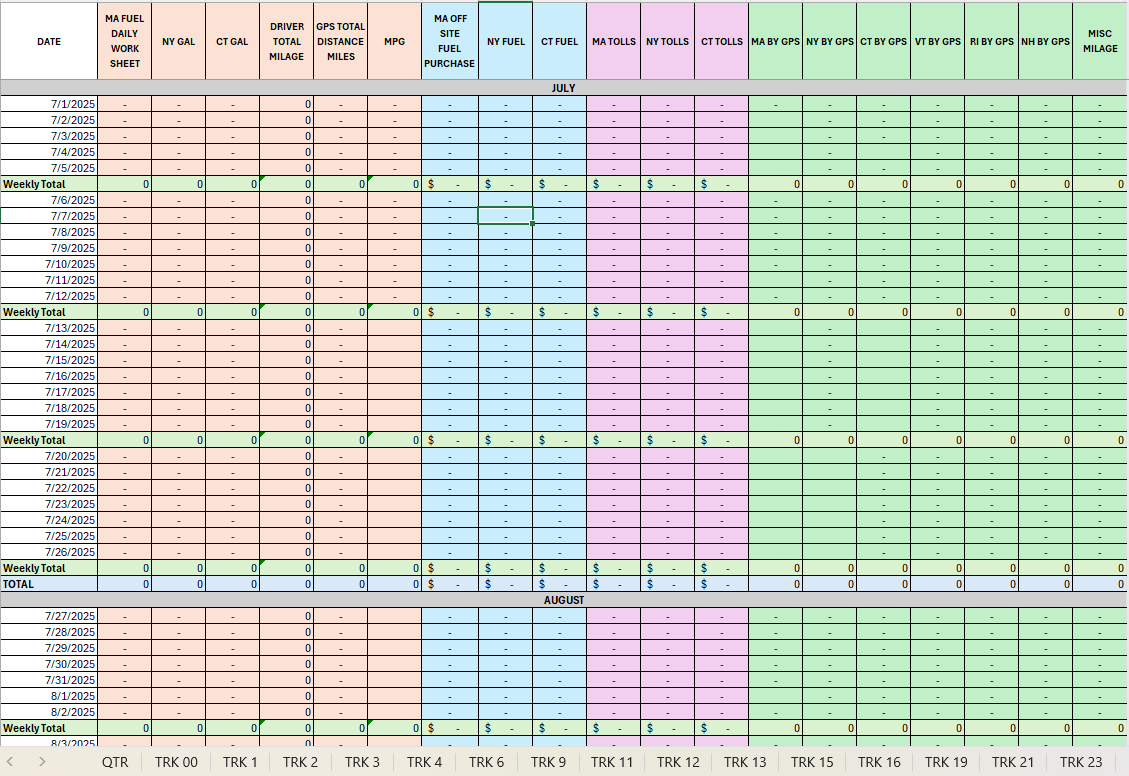
Designed for: Multi-State Trucking Operations | Quarter 3 Reporting
This advanced Excel-based dashboard was created for a trucking company contract with Torient Planning. The excel program automates International Fuel Tax Agreement (IFTA) reporting across multiple jurisdictions for a full fleet of trucks. Designed for operational use by transportation or logistics companies, this tool consolidates fuel usage and mileage data to ensure accurate tax reporting and compliance.
